

Carbon Map: Measuring What Moves Before It Reaches the Grid

A 230 MWh BESS project generates roughly 170–244 tonnes of CO₂e from transporting battery containers from factory to site under the calculation examples used in this article. Transport emissions are often missing or oversimplified in EPC ESG reporting because calculation methods sit across several frameworks and carrier data arrives in inconsistent formats.
Series
Green Corridor: ESG and Sustainability in BESS Logistics
- Current episode: Ep. 1 · Carbon Map
- Ep. 2 · Modal Shift
- Ep. 3 · Carbon Accounting
- Ep. 4 · Reverse Logistics
The Carbon / ESG Reality
Sustainability teams on BESS projects in CEE face a specific problem: the EU Battery Regulation addresses the battery's own carbon-footprint declaration, while transport emissions sit in a separate reporting category. GHG Protocol Scope 3 Category 4 covers upstream transportation and distribution of purchased goods, yet many EPC companies still treat logistics as a black box and receive a single emissions number from the forwarder at the end of the project.
The result is either approximate ESG reporting based only on distance and weight or no transport-emissions figure at all. Both approaches create audit problems.
The Numbers
Container transport from China to Burgas produces different emissions depending on route and calculation method. Using the Clean Cargo / GLEC assumptions in the source, the example uses an average container-shipping intensity of 208.2 g CO₂e per TEU-km for Q1 2026.
For a typical project of 40 BESS containers, 20' HC and around 43 tonnes each, Shanghai to Burgas:
Suez Route, Direct Service, ~30–35 Days
- Distance: approximately 16,500 km.
- Emissions per container: ~3.4 tonnes CO₂e in the example.
- Total for 40 containers: ~136 tonnes CO₂e.
Cape of Good Hope + Piraeus Transshipment, ~55–70 Days
- Distance: approximately 22,000 km mainline + 1,200 km feeder.
- Emissions per container: ~4.8 tonnes CO₂e.
- Total for 40 containers: ~192 tonnes CO₂e.
The 56-tonne CO₂e difference between the routes is real in the example but often disappears when the forwarder provides one total with no leg-by-leg breakdown.
Inland Transport, Port to Site
A 300 km road leg from Burgas to site adds around 0.8–1.2 tonnes CO₂e per container under the source's heavy-truck factors. For 40 containers that is 32–48 tonnes CO₂e.
Project Total
- Sea transport: 136–192 tonnes CO₂e.
- Inland transport: 32–48 tonnes CO₂e.
- Hub operations: 2–4 tonnes CO₂e.
- Total: 170–244 tonnes CO₂e.
These figures use GLEC Framework v3.2 default factors. Actual values vary by carrier, vessel, route, fuel and utilisation.
The Regulatory Framework
1. EU Battery Regulation 2023/1542, Article 7
The source distinguishes the battery product carbon footprint, expressed in kg CO₂e/kWh and based on Product Environmental Footprint methodology, from downstream transport from factory to final customer. That delivery transport belongs in the importer's/EPC company's Scope 3 reporting rather than being merged into the Article 7 product declaration.
2. ISO 14083:2023 and GLEC Framework v3.2
ISO 14083 provides a universal framework for quantifying greenhouse-gas emissions from transport chains. The source uses GLEC Framework v3.2 as the practical implementation methodology and calculates on a well-to-wheel basis:
- Tank-to-wheel (TTW): emissions from fuel combustion.
- Well-to-tank (WTT): emissions from producing and transporting the fuel.
3. GHG Protocol Scope 3, Category 4
Transport of purchased goods from supplier to the reporting company belongs in Upstream Transportation and Distribution. This can include sea freight, hub transshipment and inland delivery. Where transport is embedded in supplier-provided product delivery, accounting treatment may differ and needs to be aligned with the company's Scope 3 methodology.
Practical Significance
Under an FOB structure, the buyer typically organises transport from the load port, making Scope 3 Category 4 especially relevant to the EPC company. Under seller-arranged terms, the reporting treatment still needs to capture those transport emissions without double counting.
The Practical Approach
Step 1: Define the System Boundary
- Sea freight from loading port to discharge port or transshipment hub.
- Hub operations in Piraeus, Istanbul or another transshipment port.
- Feeder transport to Burgas, Varna or Constanța.
- Road transport from port to construction site.
PCS units move separately and have different weights and customs classification, so calculate them separately for better accuracy.
Step 2: Collect the Data
Minimum data:
- Cargo weight from Packing List or VGM.
- Load and discharge ports.
- Transport mode – mainline vessel, feeder, truck.
- Distance, calculated or supplied by carrier.
For a more accurate result:
- Vessel name and IMO number.
- Fuel type.
- Actual distance from AIS data.
- Vessel utilisation.
Step 3: Select Emission Factors
The source uses representative GLEC ranges:
- Medium container vessel: 15–25 g CO₂e/tkm TTW and 18–30 g CO₂e/tkm WTW.
- Heavy truck above 40 t: 50–70 g CO₂e/tkm WTW.
- Hub operations: 2–5 kg CO₂e/TEU.
Carrier- and route-specific Clean Cargo data can improve accuracy, particularly for very heavy BESS cargo.
Step 4: Calculate
ISO 14083-style formula used in the article:
Emissions (kg CO₂e) = Weight (t) × Distance (km) × Emission factor (g CO₂e/tkm) / 1000
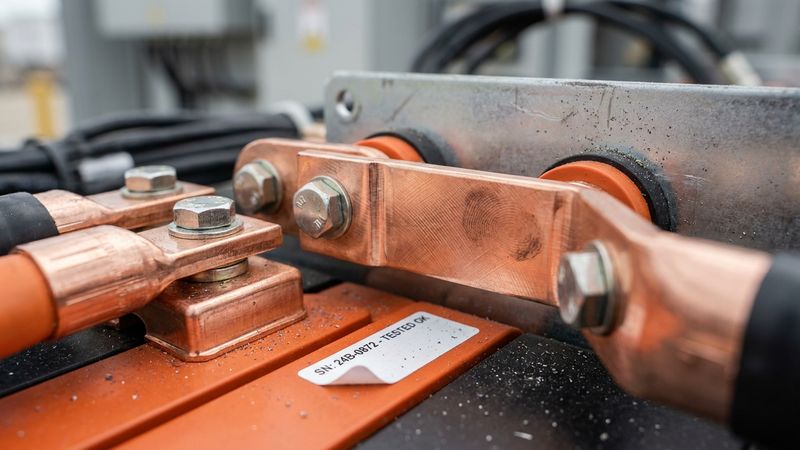
Every connection point represents thousands of kilometres of embedded carbon.
For hub operations: Emissions (kg CO₂e) = Number of TEU × hub emission factor.
Step 5: Document
The report should preserve:
- Source of emission factors.
- Methodology, such as TTW or WTW.
- Transport activity in tonne-km or TEU-km.
- Breakdown by transport leg.
The Greenwashing Trap
“Carbon-Neutral Transport” without a Breakdown
Some forwarders sell carbon-neutral shipping through offsets. Offsets do not remove the underlying Scope 3 emissions and should be reported separately. Claims also need credible standards and retirement evidence.
One Average for the Entire Route
Emission intensity varies between mainline and feeder services, between carriers and between vessels. A single average can materially under- or over-estimate the route.
Ignoring Well-to-Tank Emissions
Calculators that report only direct fuel-combustion emissions miss the upstream fuel component. The source notes WTT can add 15–25% to the result.
Mixing Battery Product Footprint with Delivery Transport
The battery's product carbon-footprint declaration and gate-to-site transport emissions should be tracked separately so the same emissions are not mixed or double counted.
A “Green Corridor” without Data
Claims of sustainable logistics without numbers, methodology and data source are marketing claims, not auditable ESG reporting.
What This Means for Your Project
- Ask forwarders for a leg-by-leg breakdown across sea, hub and inland transport.
- Confirm whether the calculation follows ISO 14083 / GLEC and includes the WTT component.
- Document route choice, because Suez and COGH routing create measurable differences.
- Calculate batteries and PCS separately for better accuracy.
- Retain Bills of Lading, transport documents and calculations in an audit-ready format.
What to Remember
- The article's 230 MWh project example produces roughly 170–244 tonnes CO₂e from logistics, depending on route and methodology.
- ISO 14083:2023 and GLEC Framework v3.2 are the reference frameworks used in the article.
- Product carbon-footprint reporting and factory-to-site logistics reporting are separate accounting layers.
- Route choice can materially change transport emissions.
- Offsets are not the same thing as reducing the underlying emissions.
Frequently Asked Questions
Q: Which standard should I use to calculate BESS transport emissions?
A: The article uses ISO 14083:2023 with GLEC Framework v3.2 as the practical methodology.
Q: Are delivery emissions included in the battery carbon-footprint declaration?
A: The article separates the battery's product footprint from factory-to-customer logistics, which is handled in Scope 3 reporting.
Q: What is the difference between TTW and WTW?
A: TTW covers direct fuel combustion; WTW adds upstream fuel-production and distribution emissions.
Q: How can I obtain carrier emissions data?
A: Request a shipment-specific emissions certificate or use a recognised framework such as GLEC when carrier-specific data is unavailable.
Q: Can carbon offsets be used in Scope 3 reporting?
A: They should be shown separately from the gross Scope 3 emissions and should not be treated as if they reduce the underlying transport-emissions figure.
Q: How much does the inland leg add?
A: In the source's 300 km example, around 0.8–1.2 tonnes CO₂e per 43-tonne container, or 32–48 tonnes for 40 containers.
Q: What should I retain for audit?
A: Bill of Lading with weight and route, carrier emissions certificate or documented calculation, methodology and emission-factor sources.